How to Read Candlestick Charts: A Beginner's Guide
Every price chart on this site can show candlesticks. Each candle packs four prices into one shape. Here is how to read them, and what the common patterns can and cannot tell you.
Key takeaways
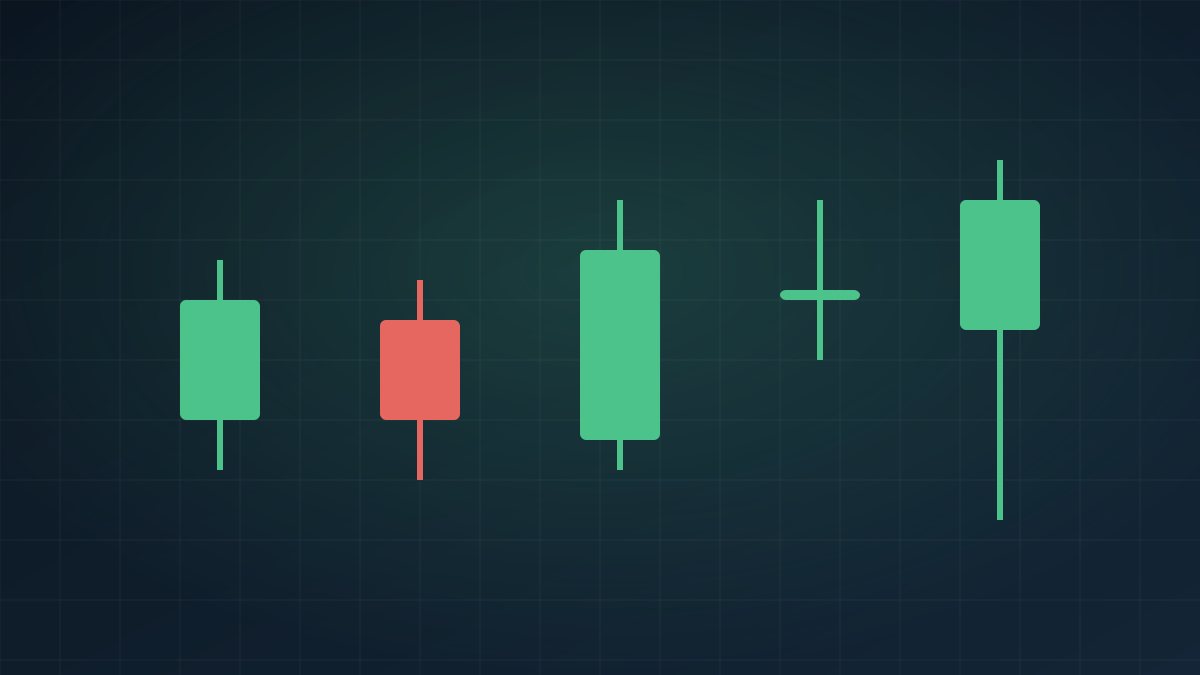
- Each candle shows four prices for a period: open, high, low and close.
- The body runs from open to close. The thin lines, called wicks, show the high and low.
- Green (or hollow) candles closed higher than they opened; red (or filled) candles closed lower.
- Patterns describe what buyers and sellers did. They do not predict the future on their own.
Anatomy of a candle
| Part | What it shows |
|---|---|
| Body | The range between the opening and closing price |
| Upper wick | The highest price reached in the period |
| Lower wick | The lowest price reached in the period |
| Color | Green: close above open. Red: close below open. |
The time period depends on the chart setting. On a daily chart each candle is one trading day; on a 1-hour chart, one hour. You can switch periods on the charts on our market pages.
Reading what happened
- Long green body: buyers were in control most of the period.
- Long red body: sellers dominated.
- Long upper wick: prices rose but were pushed back down before the close.
- Long lower wick: prices fell but buyers pushed them back up.
- Tiny body (doji): open and close were nearly equal, a sign of indecision.
Common patterns
Hammer
A small body at the top of the range with a long lower wick, after a decline. It shows sellers pushed prices down but buyers recovered most of the loss.
Shooting star
The mirror image: a small body near the bottom with a long upper wick, after a rise.
Engulfing
A candle whose body completely covers the previous candle's body in the opposite color. A bullish engulfing pattern comes after a decline; a bearish one after a rise.
Use them with care
Studies of technical patterns show mixed results, and no pattern works every time. Many investors use candlesticks only to understand recent price action, alongside volume and the bigger trend, rather than as buy or sell signals. Long-term investors usually focus more on fundamentals, covered in How to Read an Earnings Report.
Volume
Most charts show volume as bars below the candles. A big move on heavy volume carries more weight than the same move on light trading. Learn the rest of the quote screen in How to Read a Stock Quote.
This article is general education, not personalized financial advice. Read our editorial policy and disclaimer.